I want to learn more about Azure, and I love Splunk, so I wanted to see how I could get diagnostic data from Azure Key Vault into Splunk.
There's seemingly a million different ways to get log data out of Azure, with different levels of logging showing you different things.
This article: https://docs.microsoft.com/en-us/azure/security/fundamentals/log-audit does a good job of explaining the various logs found in Azure.
For today however, I am going to focus on Azure Key Vault Diagnostic Logs, streamed to an Event Hub and then picked up with Splunk using this Splunk App: https://splunkbase.splunk.com/app/4343/#/overview
In my particular scenario I have the following Azure resources:
- A blob type storage account
- An Event Hub namespace and Event Hub
- An Azure Key Vault configured to send diagnostic logs to the Event Hub
- A Splunk Instance
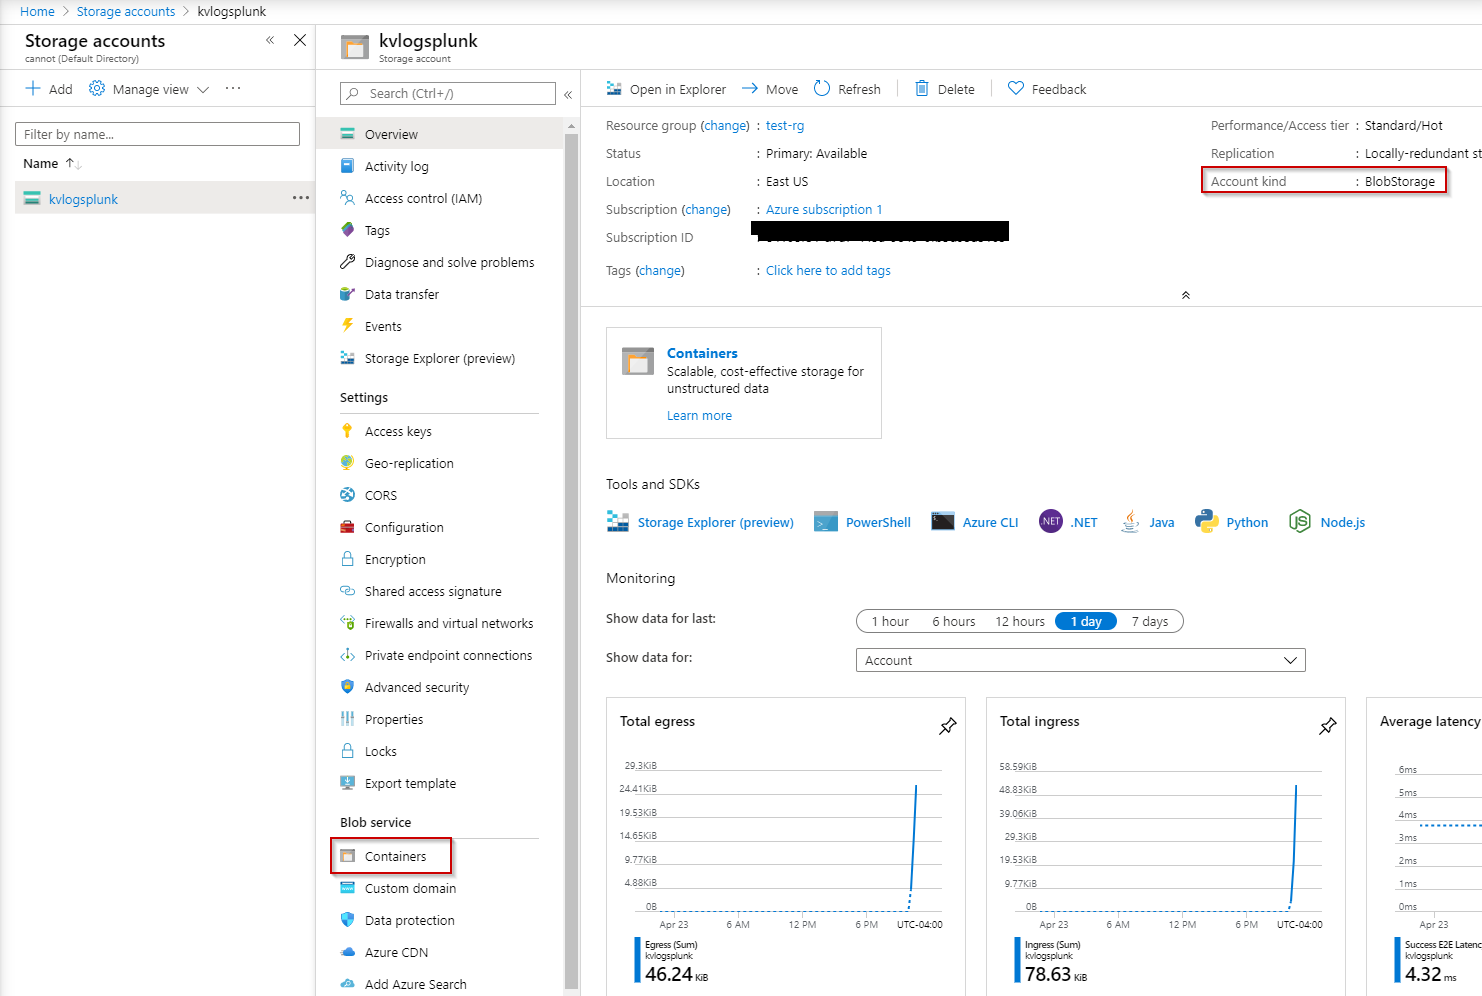
In my case I needed to create a storage account and blob container first:
And then the Event Hub itself:
Here we are turning capture on, and then selecting the container:
Now we're ready to point our Key Vault to this newly created Event Hub:
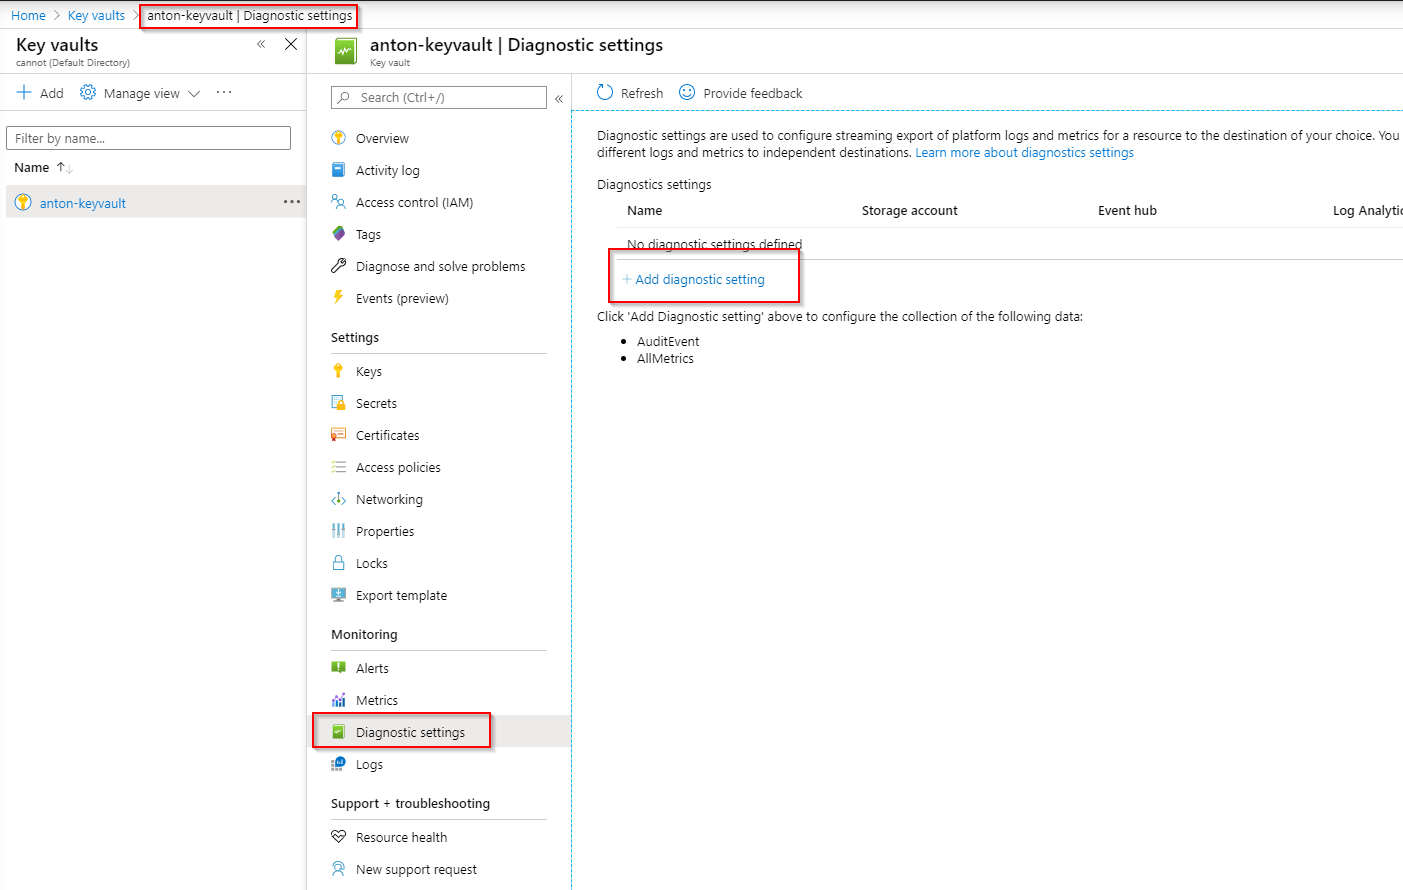
We want to enable both AuditEvents and AllMetrics, and select Stream to an Event Hub, and then pick our Subscription, Event Hub namespace, hub name and policy name:

Now that we have our Key Vault sending to our Event Hub, the next step is to configure Splunk to pick it up using the app mentioned at the start of the post:
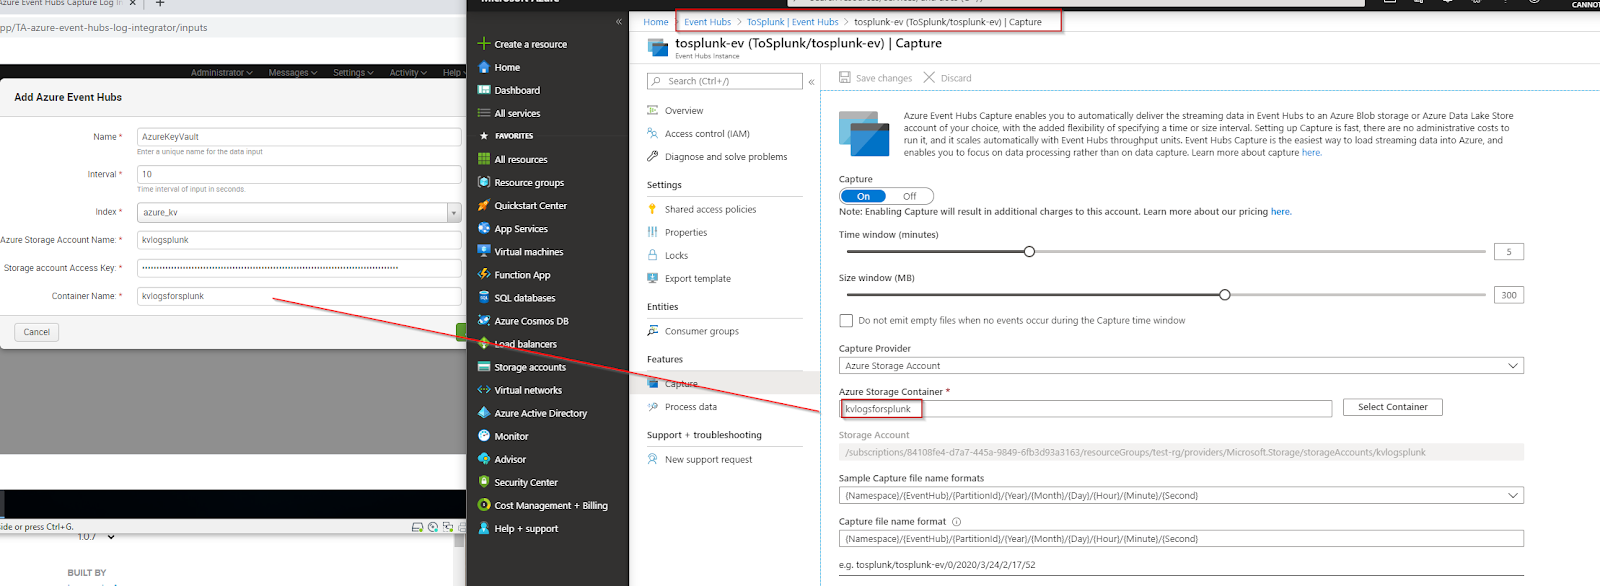
The values here are pretty straight forward:
- The index value tells Splunk where to put the data
- The Azure Storage Account Name is the name that you gave your stroage account when it was created
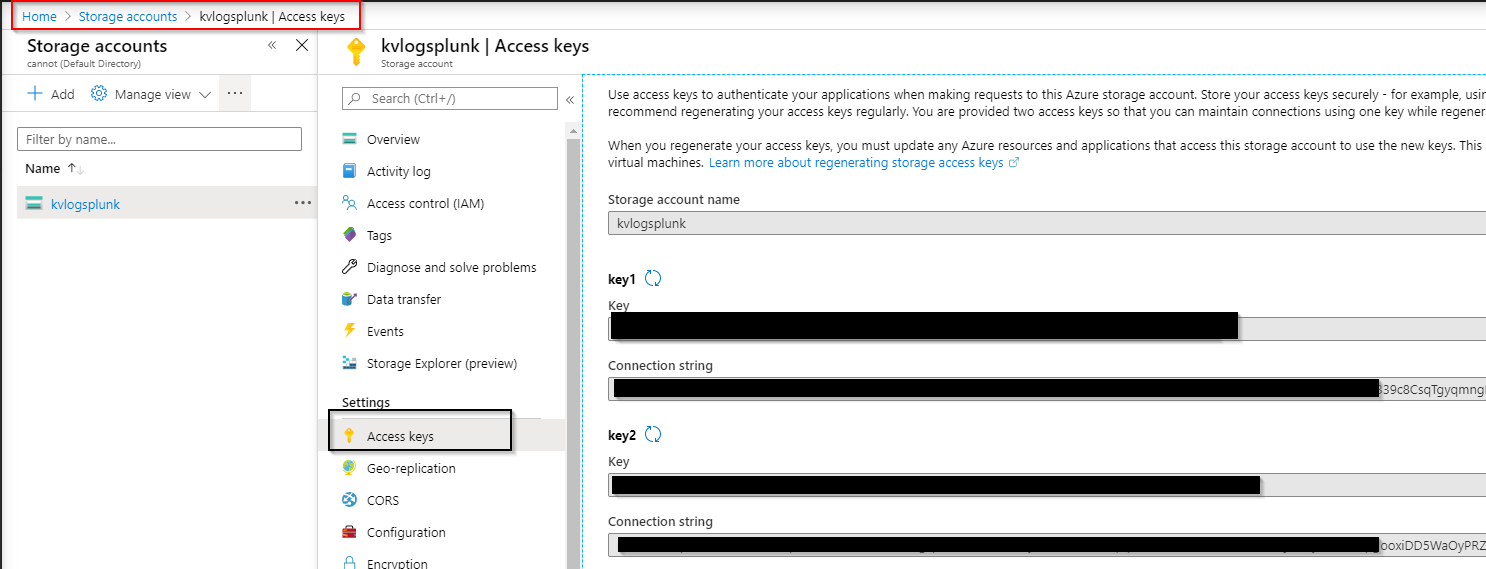
- The Storage Account Access Key Can be found here:
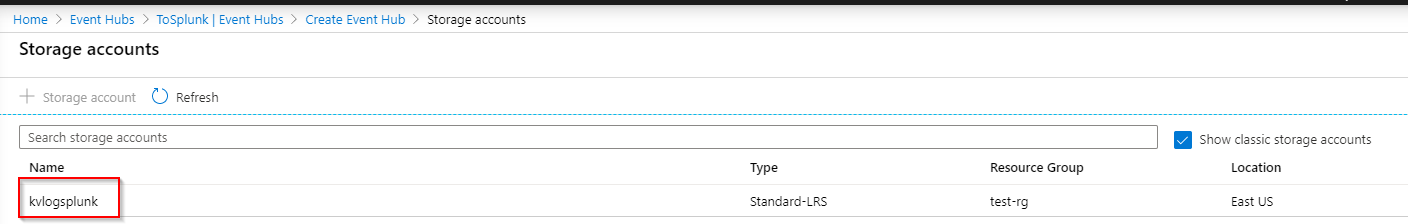
- The Container Name is the name that you gave to your container within the capture settings of your Event Hub
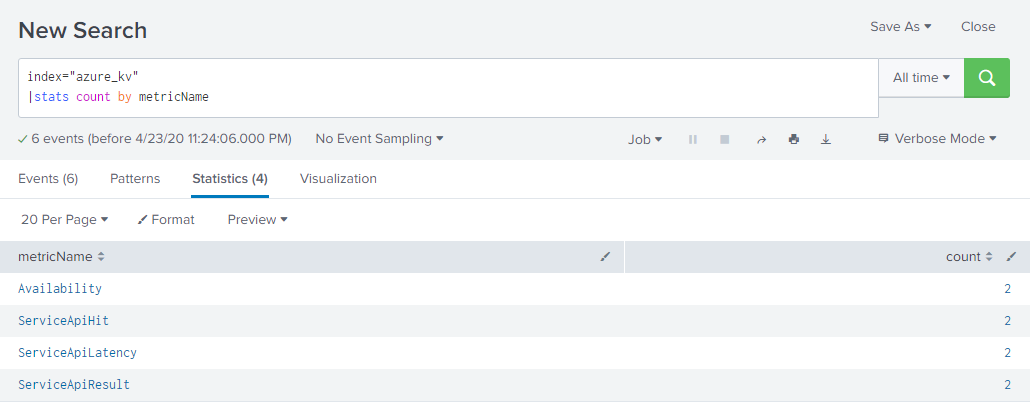
Now let's retrieve a value from our Key Vault to generate some logs:

The Key Vault data includes metrics data on API hits and latency times:
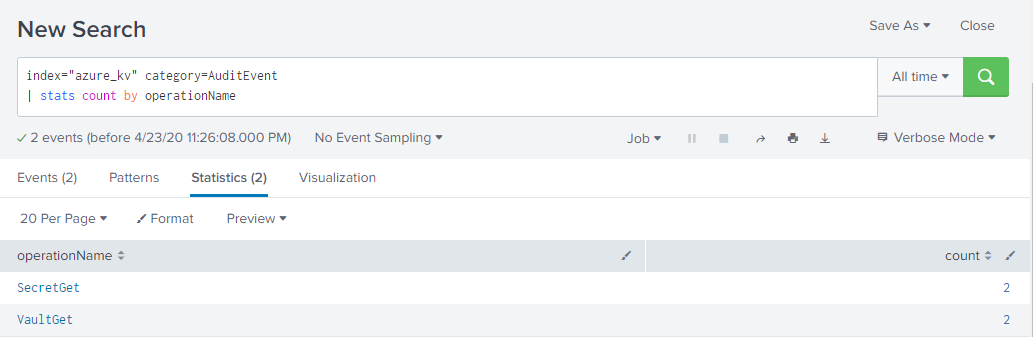
As well as operations performed on your Key Vault:
The data also includes IP addresses of the clients making the request, as well as application used and other information:
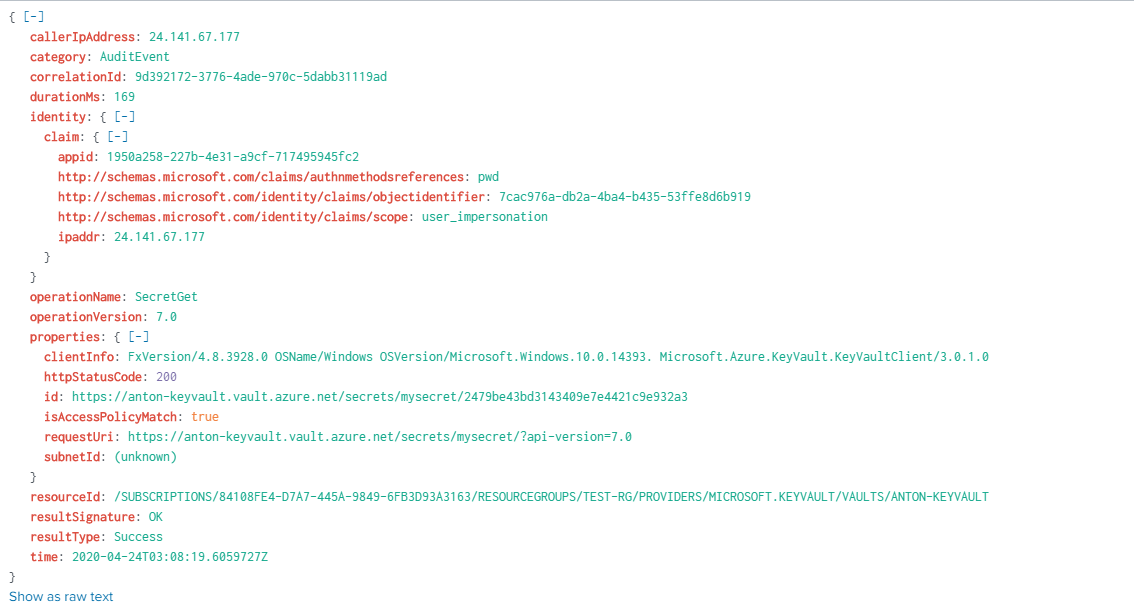
Now you can get some extra visibility into what's going on with your Azure Key Vault. Nice.
The "correlationId" field for these events can be joined together with other Azure Events for a more comprehensive view and more advanced queries (perhaps another blog post :) )
Some notes:
- I'm still learning Azure, so I have no idea if this is the "best" way to get Azure Key Vault logs into Splunk, I know Azure Monitor is a thing but I wanted to see if I could just get logs in from the Key Vault
- Check out PowerZure which will help you generate some interesting data to look at: https://posts.specterops.io/attacking-azure-azure-ad-and-introducing-powerzure-ca70b330511a
- I created all my resources in the same Azure region
- Check the networking settings of your Storage Account if stuff doesn't work
There's seemingly a million different ways to get log data out of Azure, with different levels of logging showing you different things.
This article: https://docs.microsoft.com/en-us/azure/security/fundamentals/log-audit does a good job of explaining the various logs found in Azure.
For today however, I am going to focus on Azure Key Vault Diagnostic Logs, streamed to an Event Hub and then picked up with Splunk using this Splunk App: https://splunkbase.splunk.com/app/4343/#/overview
In my particular scenario I have the following Azure resources:
- A blob type storage account
- An Event Hub namespace and Event Hub
- An Azure Key Vault configured to send diagnostic logs to the Event Hub
- A Splunk Instance
In my case I needed to create a storage account and blob container first:
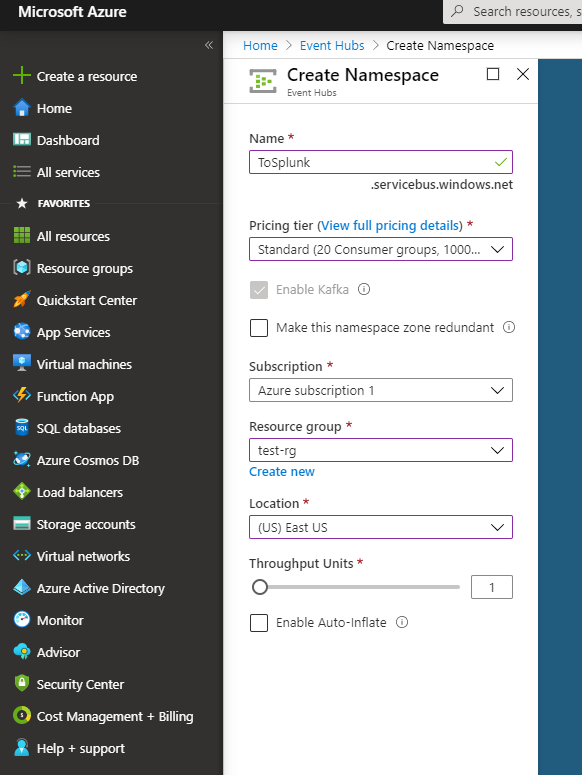
Next up we need to create the Event Hub Namespace and Event Hub, which will point to our blob storage we created above
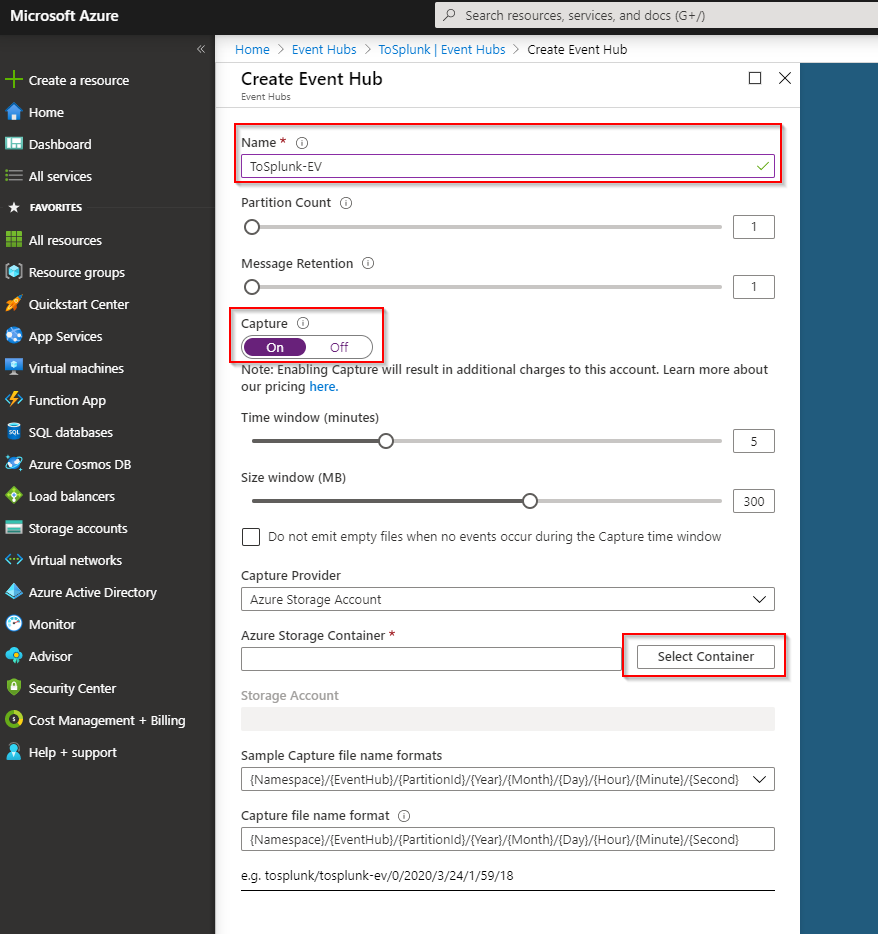
And then the Event Hub itself:
Here we are turning capture on, and then selecting the container:
Now we're ready to point our Key Vault to this newly created Event Hub:
We want to enable both AuditEvents and AllMetrics, and select Stream to an Event Hub, and then pick our Subscription, Event Hub namespace, hub name and policy name:
Now that we have our Key Vault sending to our Event Hub, the next step is to configure Splunk to pick it up using the app mentioned at the start of the post:
The values here are pretty straight forward:
- The index value tells Splunk where to put the data
- The Azure Storage Account Name is the name that you gave your stroage account when it was created
- The Storage Account Access Key Can be found here:
- The Container Name is the name that you gave to your container within the capture settings of your Event Hub
Now let's retrieve a value from our Key Vault to generate some logs:
The Key Vault data includes metrics data on API hits and latency times:
As well as operations performed on your Key Vault:
The data also includes IP addresses of the clients making the request, as well as application used and other information:
Now you can get some extra visibility into what's going on with your Azure Key Vault. Nice.
The "correlationId" field for these events can be joined together with other Azure Events for a more comprehensive view and more advanced queries (perhaps another blog post :) )
Some notes:
- I'm still learning Azure, so I have no idea if this is the "best" way to get Azure Key Vault logs into Splunk, I know Azure Monitor is a thing but I wanted to see if I could just get logs in from the Key Vault
- Check out PowerZure which will help you generate some interesting data to look at: https://posts.specterops.io/attacking-azure-azure-ad-and-introducing-powerzure-ca70b330511a
- I created all my resources in the same Azure region
- Check the networking settings of your Storage Account if stuff doesn't work